Temperature Data for Luqa, Malta
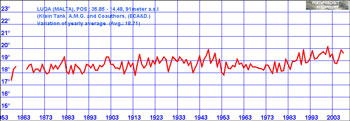
Temperature Data Covering 1853 - 2009
Population 1853:
Population 2009:
Population increase substantially effects climate. Click Here to Read More.
Enlarge Image
Population 1853:
Population 2009:
Population increase substantially effects climate. Click Here to Read More.
Enlarge Image
Hide Graph
Temperature Data for Gibraltar, British Territory
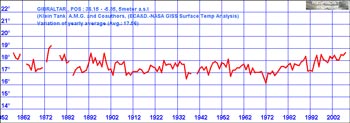
Temperature Data Covering 1852 - 2009
Population 1852:
Population 2009:
Population increase substantially effects climate. Click Here to Read More.
Enlarge Image
Population 1852:
Population 2009:
Population increase substantially effects climate. Click Here to Read More.
Enlarge Image
Hide Graph
Temperature Data for Rome, Italy
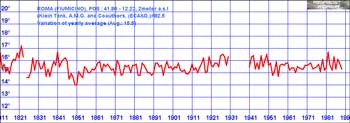
Temperature Data Covering 1811 - 1989
Population 1811:
Population 1989:
Population increase substantially effects climate. Click Here to Read More.
Enlarge Image
Population 1811:
Population 1989:
Population increase substantially effects climate. Click Here to Read More.
Enlarge Image
Hide Graph
Temperature Data for Toulouse, France
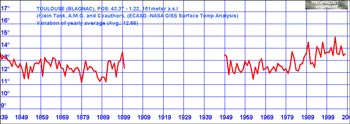
Temperature Data Covering 1839 - 2008
Population 1839:
Population 2008:
Population increase substantially effects climate. Click Here to Read More.
Enlarge Image
Population 1839:
Population 2008:
Population increase substantially effects climate. Click Here to Read More.
Enlarge Image
Hide Graph
Temperature Data for Bologna, Italy
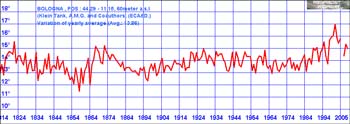
Temperature Data Covering 1814 - 2008
Population 1814:
Population 2008:
Population increase substantially effects climate. Click Here to Read More.
Enlarge Image
Population 1814:
Population 2008:
Population increase substantially effects climate. Click Here to Read More.
Enlarge Image
Hide Graph
Temperature Data for Turin, Italy
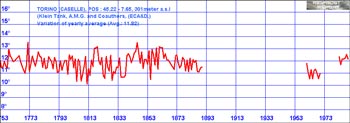
Temperature Data Covering 1753 - 1989
Population 1753:
Population 1989:
Population increase substantially effects climate. Click Here to Read More.
Enlarge Image
Population 1753:
Population 1989:
Population increase substantially effects climate. Click Here to Read More.
Enlarge Image
Hide Graph
Temperature Data for Milan, Italy
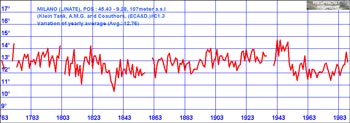
Temperature Data Covering 1763 - 1989
Population 1763:
Population 1989:
Population increase substantially effects climate. Click Here to Read More.
Enlarge Image
Population 1763:
Population 1989:
Population increase substantially effects climate. Click Here to Read More.
Enlarge Image
Hide Graph
Temperature Data for Geneva, Switzerland
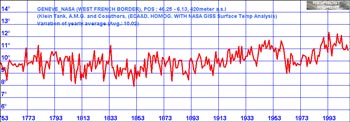
Temperature Data Covering 1753 - 2008
Population 1753:
Population 2008:
Population increase substantially effects climate. Click Here to Read More.
Enlarge Image
Population 1753:
Population 2008:
Population increase substantially effects climate. Click Here to Read More.
Enlarge Image
Hide Graph
Temperature Data for Debrecen, Hungary
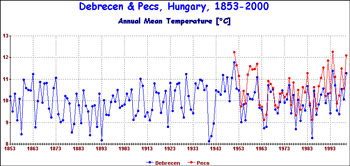
Temperature Data Covering 1853 - 2000
Population 1853:
Population 2000:
Population increase substantially effects climate. Click Here to Read More.
Enlarge Image
Population 1853:
Population 2000:
Population increase substantially effects climate. Click Here to Read More.
Enlarge Image
Hide Graph
Temperature Data for Innsbruck, Austria
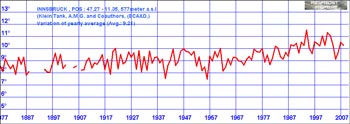
Temperature Data Covering 1877 - 2008
Population 1877:
Population 2008:
Population increase substantially effects climate. Click Here to Read More.
Enlarge Image
Population 1877:
Population 2008:
Population increase substantially effects climate. Click Here to Read More.
Enlarge Image
Hide Graph
Temperature Data for Zurich, Switzerland
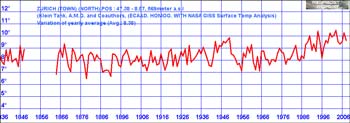
Temperature Data Covering 1836 - 2008
Population 1836:
Population 2008:
Population increase substantially effects climate. Click Here to Read More.
Enlarge Image
Population 1836:
Population 2008:
Population increase substantially effects climate. Click Here to Read More.
Enlarge Image
Hide Graph
Temperature Data for Basel, Switzerland
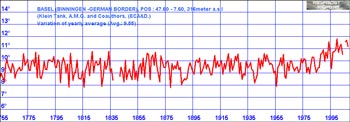
Temperature Data Covering 1755 - 2008
Population 1755:
Population 2008:
Population increase substantially effects climate. Click Here to Read More.
Enlarge Image
Population 1755:
Population 2008:
Population increase substantially effects climate. Click Here to Read More.
Enlarge Image
Hide Graph
Temperature Data for Hohenpeissenberg, Germany
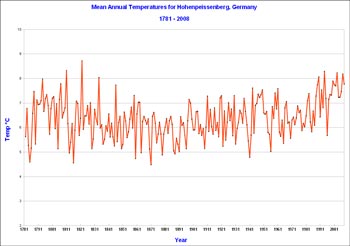
Temperature Data Covering 1781 - 2008
Population 1781:
Population 2008:
Population increase substantially effects climate. Click Here to Read More.
Enlarge Image
Population 1781:
Population 2008:
Population increase substantially effects climate. Click Here to Read More.
Enlarge Image
Hide Graph
Temperature Data for Budapest, Hungary
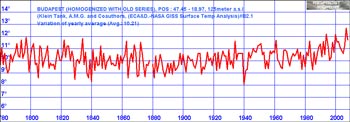
Temperature Data Covering 1780 - 2008
Population 1780:
Population 2008:
Population increase substantially effects climate. Click Here to Read More.
Enlarge Image
Population 1780:
Population 2008:
Population increase substantially effects climate. Click Here to Read More.
Enlarge Image
Hide Graph
Temperature Data for Munich, Germany
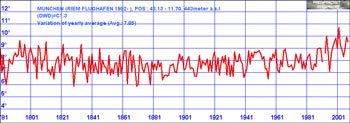
Temperature Data Covering 1781 - 2008
Population 1781:
Population 2008:
Population increase substantially effects climate. Click Here to Read More.
Enlarge Image
Population 1781:
Population 2008:
Population increase substantially effects climate. Click Here to Read More.
Enlarge Image
Hide Graph
Temperature Data for Kremsmuenster, Austria
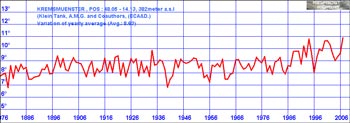
Temperature Data Covering 1876 - 2007
Population 1876: 1,200
Population 2007: 6,626
Population increase substantially effects climate. Click Here to Read More.
Enlarge Image
Population 1876: 1,200
Population 2007: 6,626
Population increase substantially effects climate. Click Here to Read More.
Enlarge Image
Hide Graph
Temperature Data for Vienna, Austria

Temperature Data Covering 1775 - 2005
Population 1775:
Population 2005:
Population increase substantially effects climate. Click Here to Read More.
Enlarge Image
Population 1775:
Population 2005:
Population increase substantially effects climate. Click Here to Read More.
Enlarge Image
Hide Graph
Temperature Data for Strasbourg, France
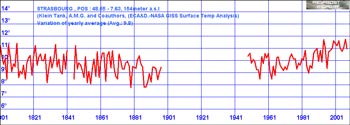
Temperature Data Covering 1801 - 2008
Population 1801:
Population 2008:
Population increase substantially effects climate. Click Here to Read More.
Enlarge Image
Population 1801:
Population 2008:
Population increase substantially effects climate. Click Here to Read More.
Enlarge Image
Hide Graph
Temperature Data for Stuttgart, Germany
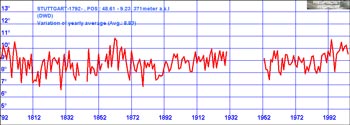
Temperature Data Covering 1792 - 2004
Population 1792:
Population 2004:
Population increase substantially effects climate. Click Here to Read More.
Enlarge Image
Population 1792:
Population 2004:
Population increase substantially effects climate. Click Here to Read More.
Enlarge Image
Hide Graph
Temperature Data for Paris, France
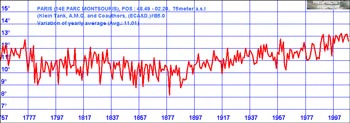
Temperature Data Covering 1757 - 2009
Population 1757:
Population 2009:
Population increase substantially effects climate. Click Here to Read More.
Enlarge Image
Population 1757:
Population 2009:
Population increase substantially effects climate. Click Here to Read More.
Enlarge Image
Hide Graph
Temperature Data for Frankfurt, Germany
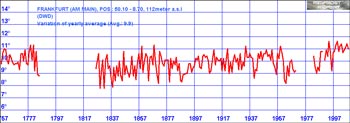
Temperature Data Covering 1757 - 2008
Population 1757:
Population 2008:
Population increase substantially effects climate. Click Here to Read More.
Enlarge Image
Population 1757:
Population 2008:
Population increase substantially effects climate. Click Here to Read More.
Enlarge Image
Hide Graph
Temperature Data for Prague, Czech Republic
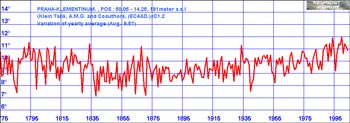
Temperature Data Covering 1775 - 2004
Population 1775:
Population 2004:
Population increase substantially effects climate. Click Here to Read More.
Enlarge Image
Population 1775:
Population 2004:
Population increase substantially effects climate. Click Here to Read More.
Enlarge Image
Hide Graph
Temperature Data for UCCLE, Belgium
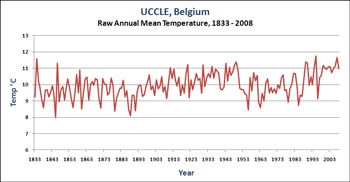
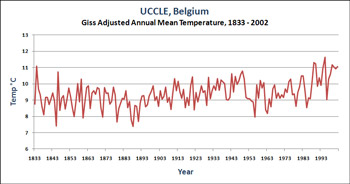
Temperature Data Covering 1833 - 2008
Population 1833:
Population 2008:
Population increase substantially effects climate. Click Here to Read More.
Enlarge Image
Population 1833:
Population 2008:
Population increase substantially effects climate. Click Here to Read More.
Enlarge Image
Hide Graph
Temperature Data for Wroclaw, Poland
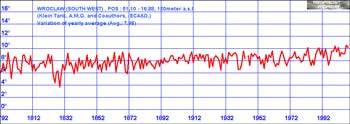
Temperature Data Covering 1792 - 2008
Population 1792:
Population 2008:
Population increase substantially effects climate. Click Here to Read More.
Enlarge Image
Population 1792:
Population 2008:
Population increase substantially effects climate. Click Here to Read More.
Enlarge Image
Hide Graph
Temperature Data for Greenwich, UK
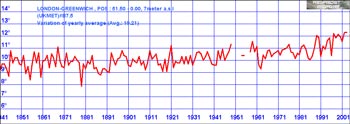
Temperature Data Covering 1841 - 2003
Population 1841:
Population 2003:
Population increase substantially effects climate. Click Here to Read More.
Enlarge Image
Population 1841:
Population 2003:
Population increase substantially effects climate. Click Here to Read More.
Enlarge Image
Hide Graph
Temperature Data for De Bilt, Netherlands
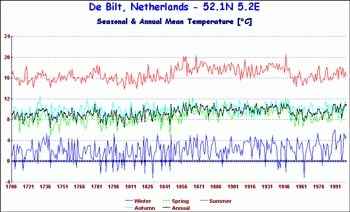
Temperature Data Covering 1706 - 2000
Population 1706:
Population 2000:
Population increase substantially effects climate. Click Here to Read More.
Enlarge Image
Population 1706:
Population 2000:
Population increase substantially effects climate. Click Here to Read More.
Enlarge Image
Hide Graph
Temperature Data for Oxford, UK
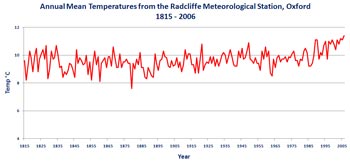
Temperature Data Covering 1815 - 2006
Population 1815:
Population 2006:
Population increase substantially effects climate. Click Here to Read More.
Enlarge Image
Population 1815:
Population 2006:
Population increase substantially effects climate. Click Here to Read More.
Enlarge Image
Hide Graph
Temperature Data for Berlin, Germany
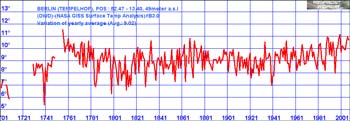
Temperature Data Covering 1701 - 2009
Population 1701:
Population 2009:
Population increase substantially effects climate. Click Here to Read More.
Enlarge Image
Population 1701:
Population 2009:
Population increase substantially effects climate. Click Here to Read More.
Enlarge Image
Hide Graph
Temperature Data for Central England, UK
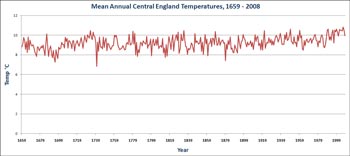
Temperature Data Covering 1659 - 2008
Population 1659:
Population 2008:
Population increase substantially effects climate. Click Here to Read More.
Enlarge Image
Population 1659:
Population 2008:
Population increase substantially effects climate. Click Here to Read More.
Enlarge Image
Hide Graph
Temperature Data for Warsaw, Poland
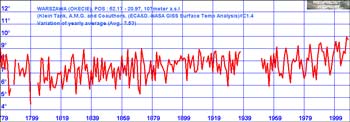
Temperature Data Covering 1779 - 2009
Population 1779:
Population 2009:
Population increase substantially effects climate. Click Here to Read More.
Enlarge Image
Population 1779:
Population 2009:
Population increase substantially effects climate. Click Here to Read More.
Enlarge Image
Hide Graph
Temperature Data for Durham, UK
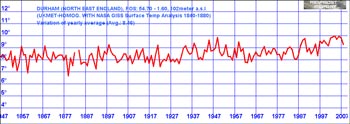
Temperature Data Covering 1847 - 2008
Population 1847:
Population 2008:
Population increase substantially effects climate. Click Here to Read More.
Enlarge Image
Population 1847:
Population 2008:
Population increase substantially effects climate. Click Here to Read More.
Enlarge Image
Hide Graph
Temperature Data for Armagh, N. Ireland
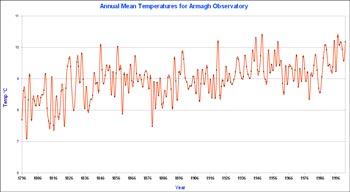
Temperature Data Covering 1796 - 2002
Population 1796:
Population 2002:
Population increase substantially effects climate. Click Here to Read More.
Enlarge Image
Population 1796:
Population 2002:
Population increase substantially effects climate. Click Here to Read More.
Enlarge Image
Hide Graph
Temperature Data for Copenhagen, Denmark
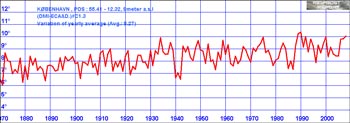
Temperature Data Covering 1870 - 2008
Population 1870: 125,000
Population 2008: 1.1m
Population increase substantially effects climate. Click Here to Read More.
Enlarge Image
Population 1870: 125,000
Population 2008: 1.1m
Population increase substantially effects climate. Click Here to Read More.
Enlarge Image
Hide Graph
Temperature Data for Vilnius, Lithuania
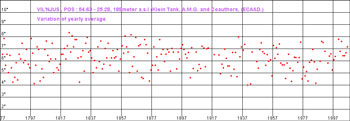
Temperature Data Covering 1777 - 2007
Population 1777: 15,000
Population 2007: 555,000
Population increase substantially effects climate. Click Here to Read More.
Enlarge Image
Population 1777: 15,000
Population 2007: 555,000
Population increase substantially effects climate. Click Here to Read More.
Enlarge Image
Hide Graph
Temperature Data for Stockholm, Sweden

Temperature Data Covering 1755 - 2005
Population 1722: 2,500
Population 2005: 130,000
Population increase substantially effects climate. Click Here to Read More.
Enlarge Image
Population 1722: 2,500
Population 2005: 130,000
Population increase substantially effects climate. Click Here to Read More.
Enlarge Image
Hide Graph
Temperature Data for Oslo, Norway
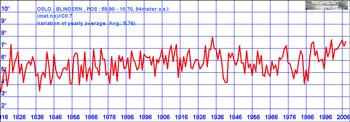
Temperature Data Covering 1816 - 2008
Population 1816: 17,500
Population 2008: 1.4m
Population increase substantially effects climate. Click Here to Read More.
Enlarge Image
Population 1816: 17,500
Population 2008: 1.4m
Population increase substantially effects climate. Click Here to Read More.
Enlarge Image
Hide Graph
Temperature Data for Uppsala, Sweden
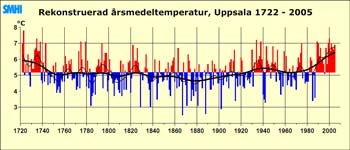
Temperature Data Covering 1722 - 2005
Population 1722:
Population 2005:
Population increase substantially effects climate. Click Here to Read More.
Enlarge Image
Population 1722:
Population 2005:
Population increase substantially effects climate. Click Here to Read More.
Enlarge Image
Hide Graph
Temperature Data for St Petersburg, Russia
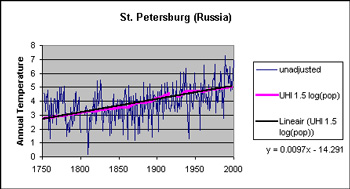
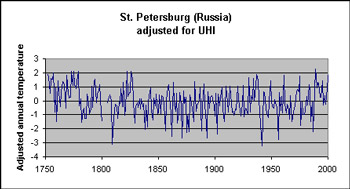
Temperature Data Covering 1750 - 2000
Population 1750:
Population 2000:
Population increase substantially effects climate. Click Here to Read More.
Enlarge Image
Population 1750:
Population 2000:
Population increase substantially effects climate. Click Here to Read More.
Enlarge Image
Hide Graph
Temperature Data for Trondheim, Norway
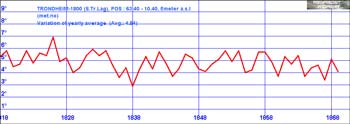
Temperature Data Covering 1818 - 1869
Population 1818:
Population 1869:
Population increase substantially effects climate. Click Here to Read More.
Enlarge Image
Population 1818:
Population 1869:
Population increase substantially effects climate. Click Here to Read More.
Enlarge Image
Hide Graph
Temperature Data for Stykkisholmur, Iceland
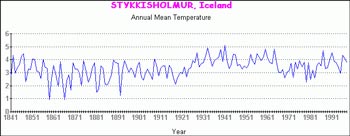
Temperature Data Covering 1841 - 2008
Population 1841:
Population 2008:
Population increase substantially effects climate. Click Here to Read More.
Enlarge Image
Population 1841:
Population 2008:
Population increase substantially effects climate. Click Here to Read More.
Enlarge Image
Hide Graph
Temperature Data for Vardo, Norway
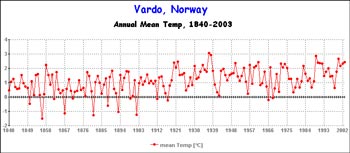
Temperature Data Covering 1840 - 2003
Population 1840:
Population 2003:
Population increase substantially effects climate. Click Here to Read More.
Enlarge Image
Population 1840:
Population 2003:
Population increase substantially effects climate. Click Here to Read More.
Enlarge Image
Hide Graph